In this post we will look at the changes that have taken place in trade union membership by United Kingdom regions. First we will look at the numerical changes between 2001 and 2014, and then we will look at the percentage changes.
In terms of actual numbers the North West has the largest number of trade unionists, with just over 806,000 in 2014. However, this down from 925,000 in 2001, a decrease of 118,000. The second largest union membership in 2014 was in the South East, which had 690,000 members. Between 2001 and 2014 the trade union membership in the South East declined by nearly 93,000. However, the second largest decrease in actual trade union membership occurred in the West Midlands. Membership here declined by just under 95,000 to 551,000 from just over 646,000.
Two regions Yorkshire and Humberside, and Wales effectively maintained their membership with increases of 324 and 1,677 respectively.
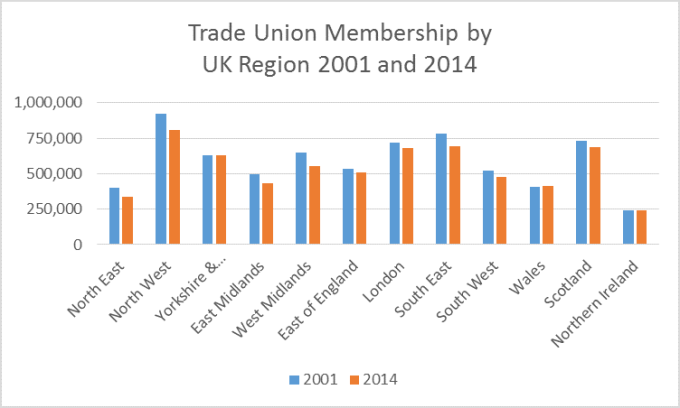 The average decrease for the regions was just under 50,000.
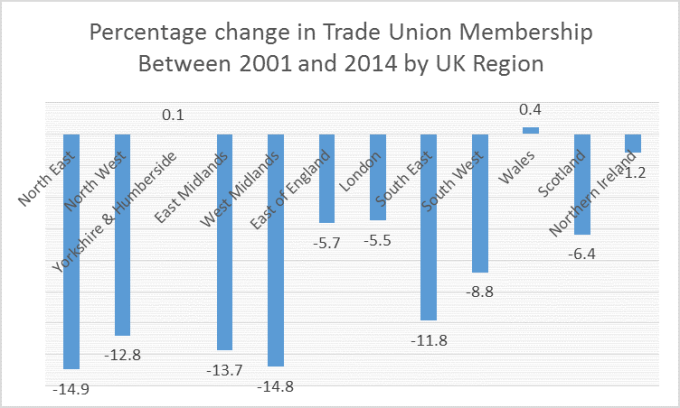
Looking at the Percentage Changes
Looking at the absolute changes does not gives us a clear picture as to what is happening to changing trade union membership in the UK regions. This graph shows the changes in trade union membership in percentage terms between 2001 and 2014. This shows that the largest percentage decline occurred in the North East, where it declined by just under fifteen percent. This was followed by the West Midlands, again just under fifteen percent. Next came the East Midlands with a decline of just under fourteen percent.
Only Wales and Yorkshire and Humberside had marginal positive percentage growth.
The average percentage decline for the UK regions was just under eight percent.