Four years of a slight but steady increase in trade union membership!

First Estimates of Trade Union Membership 2020.

According to the Gov.UK website, the Department for Business, Energy and Industrial Strategy (BEIS) – see https://www.gov.uk/government/statistics/announcements/trade-union-statistics-2020 – is due to publish the trade union statistics and bulletin for 2020 on the 27th of May.

This blog examines the changes in trade union(TU) membership by gender between 2019 and 2020 using data from the October-December Labour Force Survey (LFS) and changes in the overall TU membership between 2001 and 2020.

Between 2019 and 2020, total TU membership increased by 107,970 – see Table 1 – an increase of 1.7 per cent. Both male and female TU membership increased by 1.7 per cent. The actual increases were 46,142 for males and 61,828 for females.

YearMaleFemaleTotal
20192,752,7943,693,4676,446,261
20202,798,9363,755,2956,554,231
2019-20
Actual change46,14261,828107,970
% Change1.71.71.7

Table 1: Trade Union Membership Employees 2019-20

Source: LFS Oct-Dec 2019-20

Overall there was an increase of 1.1 per cent in TU density between 2019-20. Male TU density increased by 1.5 per cent, and female TU density increased by 0.8 per cent.

YearMaleFemaleTotal
201919.926.823.3
202020.127.023.6
2019-20
Actual change0.30.20.3
% Change1.50.81.1

Table 2: Trade Union Density 2019-20

Source: LFS Oct-Dec 2019-20

Change in TU Membership by Employees Between 2001-20

Between 2001 and 2020, TU membership has declined by 489,501; however, there are significant differences between genders. Male TU membership declined by 891,653, and as we shall see in a later blog, this was due in the main to the loss of manufacturing employment. Female TU membership increased by 402,152. However, this increase was not sufficient to counter the loss of male jobs – see Table 3 – resulting in the 489,501 net loss of TU membership.

YearMaleFemaleTotal
20013,690,5893,353,1437,043,732
20202,798,9363,755,2956,554,231
2001-20
Actual change-891,653402,152-489,501
% Change-24.212.0-6.9
Source: Labour Force Survey October-December 2001 and 2020

Table 3: Trade Union Membership Employees 2019-20

Source: LFS Oct-Dec 2001 and 2020

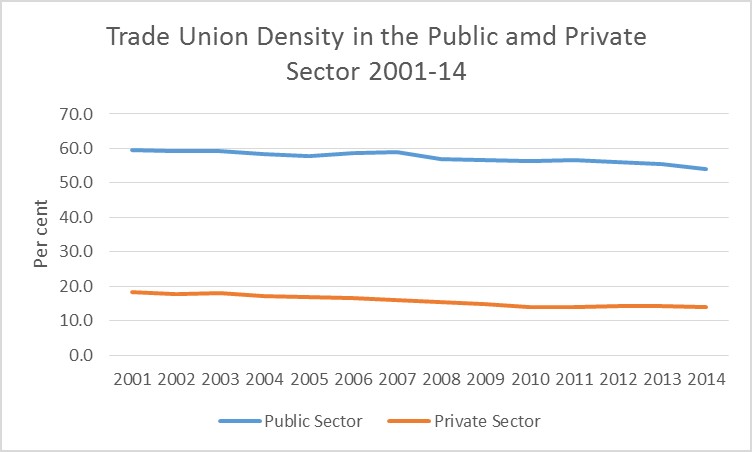
Trade union density declined for both male and female membership – see Table 4. Although TU membership increased between 20001 and 2020, it did not increase at the same rate as female employment, which increased by 3,447,788 or 14.2 per cent.

YearMaleFemale[i]Total
200129.728.523.3
202020.127.023.6
2001-20
Actual change-9.8-1.7-5.8
% Change-33.1-11.5-21.1

Table 4: Trade Union Membership Employees 2019-20

Source: LFS Oct-Dec 2001 and 2020

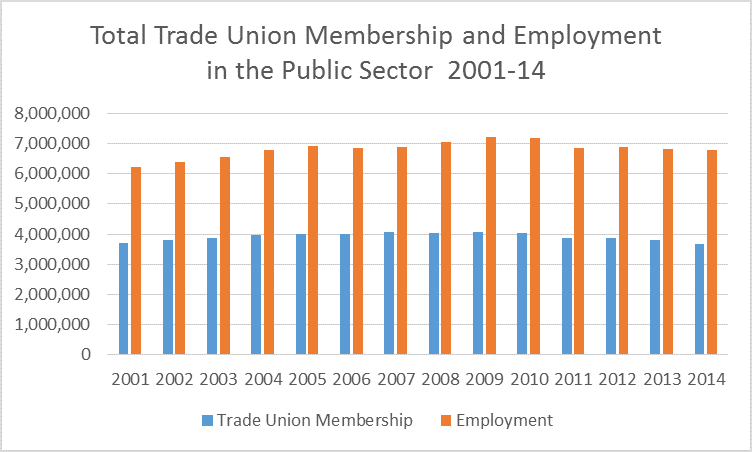
In Fig1 we show the TU membership for all employees between 2001 and 2020.


Fig1 Trade Union Membership by Employees 2001-20

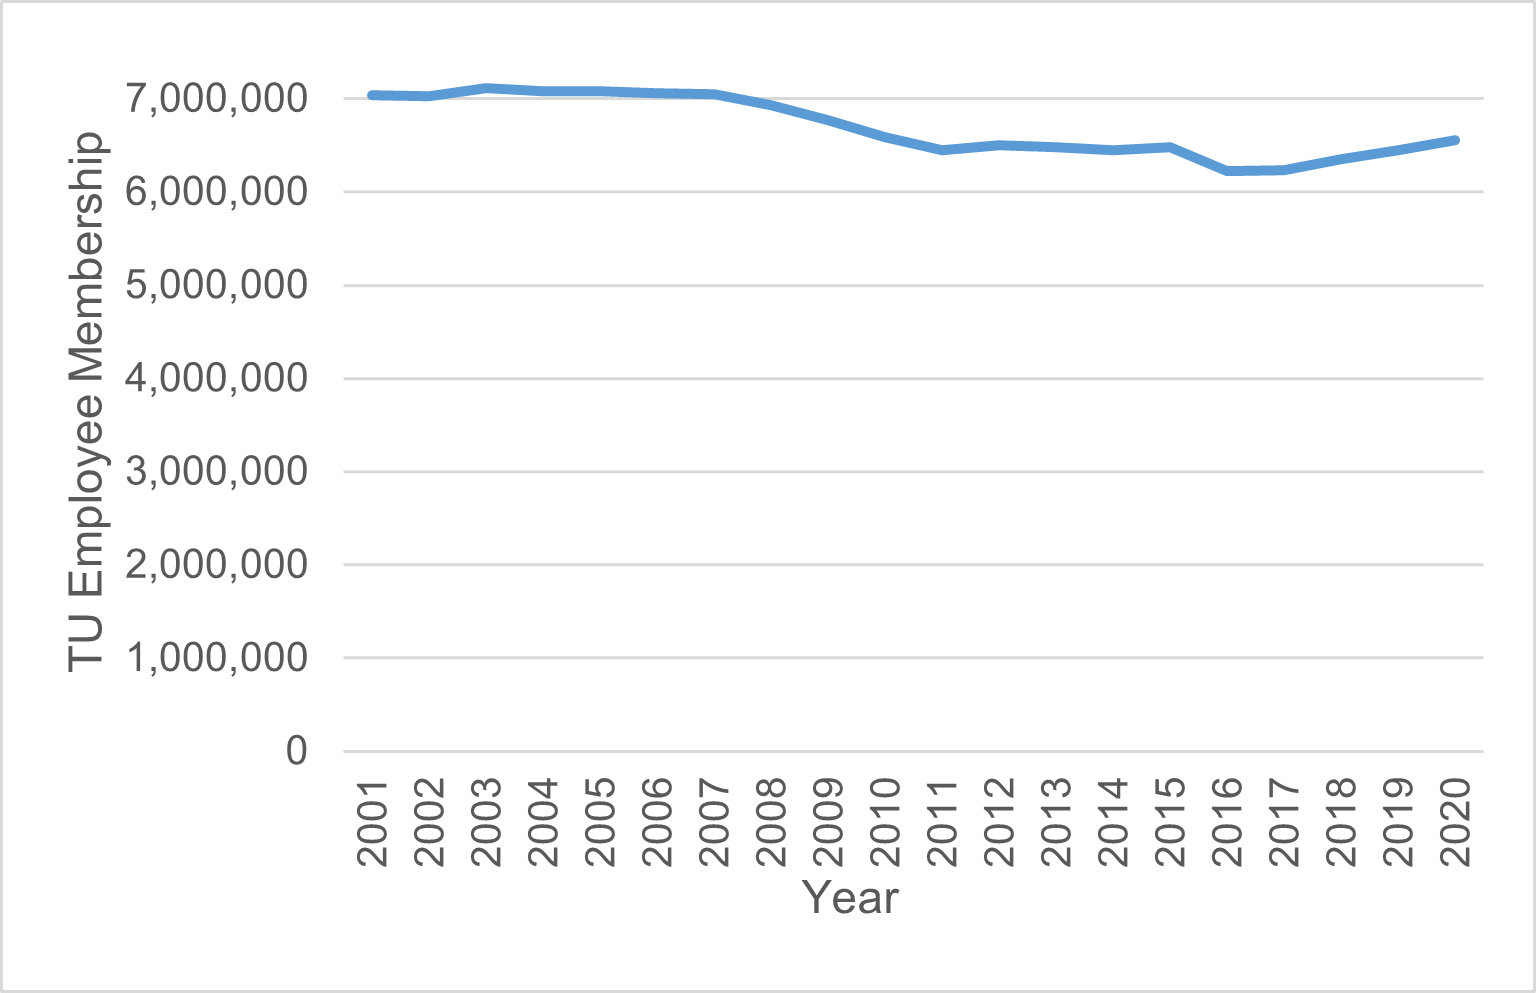
Source: Labour Force Surveys Oct-Dec 2001 to 2020.

Techincal Note

The figures published in this blog may not precisely match those published by BEIS due to rounding errors. In the past, there has been a difference of about 3,000 in each gender group between our figures and those published by BEIS.

The Office of National Statistics is reweighting the LFS from June this year, and as soon as the reweighted data is available, we will issue blogs with the revised figures.

Acknowledgement

We would like to thank Ivan Bishop, Statistician, Labour Market Directorate, Department for Business, Energy & Industrial Strategy, for his advice relating to calculating the statistics used for this blog.

[i] Figuers may not tally due to rounding errors

Changes in Trade Union Membership by Employment Status and Gender 2001-19

In the previous blog – First Estimates of Trade Union membership in 2019  – we discussed the change in trade union (TU) membership by gender between 2001 and 2019 in the United Kingdom for employees. In this blog, we shall analyse changes in TU membership by employment status and gender for the same period using changes in TU density, employment, and the composition of the workforce for our analysis.

The data source for this analysis is the Office of National Statistics (ONS) labour force survey (LFS) Oct-Dec for the years 2001-2019.

Fig 1: Changes in Trade Union Membership by Gender and Employment Status 2001-2019.

Source: ONS LFS

From Fig 1, we can see that full-time (FT) male TU membership declined by just over one million, a decline of 28 per cent. During the same period, there was an expansion in female TU membership of 201,000, a nine per cent growth.

Part-time TU male membership grew by 67,408 an increase of 50.3 per cent. At the same time, female TU membership increased by134,665 a growth rate of 12.0 per cent.

Fig 2, shows the change in employment status by gender between 2001 and 2019. Male FT employment increased by 904,377 a growth rate of 8.0 per cent. At the same time, PT male employment grew by 49.0 per cent an increase of 522,448.

Fig 2: Change in employment by gender and employment status 2001-2019.

Source: ONS LFS

Female FT employment increased significantly by 1,745,950 a 26.0 per cent increase. At the same time, female PT employment climbed by 259,924 a rise of 5.1 per cent.

In Fig 3, we show the changes in the composition of employees by gender and employment status between 2001-2019. The male FT composition declined by 2.6 per cent from 47.0 to 44.4 per cent. Conversely, the male PT composition of the workforce increased by 1.3 per cent from 4.4 to 5.7 per cent.  During the same period, the female structure increased by 2.9 per cent to 30.6 per cent. There was a slight decline in the female PT composition of 1.7 per cent from 20.9 to 19.3 per cent.

Fig 3: Changes in the Composition of Employees by Gender and Employment Status 2001-2019

Source: ONS LFS

By using the composition of employees, it has allowed us to identify precisely that the significant change in TU membership has been in male FT membership. This decline of 1.01m FT male TU members has to assessed in the context of the 0.9m jobs created. Even without the 0.9m increase in male FT employment, the TU density would have been 23.5, resulting in an 8.9 decline in density to 22.5.

In future blogs, we will look in more detail at where this 1.01m decline FT male members occurred.

First Estimates of Trade Union Membership in 2019

This article is the first of a series of blogs which will analyse the changes in trade union (TU) membership in the United Kingdom (UK) between 2001 and 2019 for all employees. The source of the data is the October- December Labour Force Survey for the relevant years. Figure 1 shows the total trade membership of employees in the UK from 2001 to 2019.


Fig 1


Between 2001 and 2007 TU membership of employees remained stable at just over 7 million members. In 2008 it went below 7 million for the first time, this decrease we can assume was due in part to the financial crisis of that year. The downward trend continued until 2011, and then there was a slight rebound in TU membership in 2012. However, the downward trend in TU membership continued until 2016. Since 2016 there has been a small increase in TU membership of 225,683 a rise of 3.6 per cent. Between 2001 and 2019 TU membership declined overall by 597,471 a fall of 8.5 per cent.

In Figure 2, we show that TU total density decreased by 5.8 to 23.3 per cent; however, between 2018 and 2019, TU density increased by 0.2 per cent. The 0.2 per cent increase is the first time that TU density has not decreased year on year since 2001.


Fig 2


In Figure 3, we show TU membership by gender between 2001 and 2019.


Fig 3

Female TU membership has increased by 340,324 to 3,693,467 by 2019. However, even though female TU membership has grown, it has failed to maintain its TU density. Female TU density declined by 1.7 to 26.8 per cent, see Fig 4.

Conversely, male TU membership has continued to decline. Between 2001 and 2019 male TU membership fell by 937,795 to 2,752,794. Male TU density also declined during this period down 9.8 to 19.9 per cent, see Fig 4.


Fig 4

Conclusion

Trade union are still under considerable pressure in regards to their membership. However, there are signs of hope with a small increase in TU membership and the slightest rise in TU density. The TU’s remain the most significant members of civil society collectively in the UK.

In the next blog, we will examine in more details the changes in trade union membership by gender and employment status.

First Estimates of Trade Union Membership in 2018

The Department for Business, Energy & Industrial Strategy (BEIS) will publish its Trade union statistics 2018 statistical bulletin on the 30th May.

In anticipation of this we have estimated the changes in trade union membership in the United Kingdom (UK) using data from the 2017 and 2018 October – December Labour Force Survey(LFS) produced by the Office of National Statistics (ONS).

1 Trade Union Membership

Between 2017 and 2018 the total trade union membership, who are employees, increased  by 106,000, an increase of 1.7 per cent.

There has been a very small decrease in male trade union membership of 0.8 per cent, and a more substantial increase in female trade union membership of 3.8 per cent, or 128,000 – see Fig 1.

Female and Male Trade Union Membership

Fig 1: Female and Male Trade Union Membership 2017-18 Source ONS

2 Trade Union Density 

In this blog Trade Union density refers to the ratio of the number of employees who are members of trade unions to the total number of employees in the UK. Some academics use trade union density rates as a proxy for trade union power. The greater the trade union density the more powerful, in collective bargaining terms a trade union is assumed to be.

Between 2017 and 2018 male trade union density declined by 0.4 from 20.8 per cent to 20.4 per cent, a decrease of 2.1per cent.

Conversely female trade union density increased from 25.2 per cent to 25.8 an increase of 2.4 per cent – see Fig 2.

The total TU density increased by 0.1 per cent from 23.0 to 23.1 per cent.

Fig 2: Female and Male Trade Union Density 2017-18 Source ONS

3 Trade Union Composition

The composition of male trade union employees between 2017 and 2018 decreased by 1.1 from 45.7 to 44.6 per cent, a decrease of 2.4 per cent – see Figure 3. It is obvious that the female composition increased by 1.1 from 54.3 to 55.4 an increase of 2 per cent.

Fig 3: Female and Male Trade Union Composition 2017-18 Source ONS. 

4 Employment

Between 2017 and 2018 male employees increased by 192,000 from 13.7m to 13.9m an increase of 1.4 per cent. For female employees the increase in employment was slightly less at 186,000 from 13.7m to 13.9m an increase of 1.4 percent – see Figure 4.

Total employee employment increased by 378,000, an increase of 1.4 per cent.

Fig 4: Female and Male Employment ‘000 2017-18 Source ONS

5 Employee Composition

In the period between 2017 and 2018 the male and female composition of the employee workforce  remained stable at  50.5 per cent and 49.5 per cent  – see Figure 5.

Fig 5: Female and Male Employment Composition 2017-18 Source ONS 

Technical Note

The BEIS figures may differ slight from the figures used in this blog. There are three reasons for this. The first is rounding errors, and the second is that we are using a more aggregated data set than that used by BEIS. Third is the weight used by BEIS used in its calculations. Unfortunately, BEIS does not report the weighting used in its bulletin so it is possible that we are using a different weighting to BEIS. However, the differences are well within normal margins of statistical error.

First Estimates of the United Kingdom Trade Union Membership in 2017

We have estimated the changes in trade union membership using data from the 2016 and 2017 October – December Labour Force Survey produced by the Office of National Statistics (ONS).

1 Trade Union Membership

There has been a very small increase in male trade union membership of 0.9 per cent, and a slight decline in female trade union membership of 0.4 per cent – see Fig 1. Overall there has been an increase of 10,000 members, an increase of .0.2 per cent.

Over all employee trade union membership remains relatively stable in actual numbers.

Trade Union membership
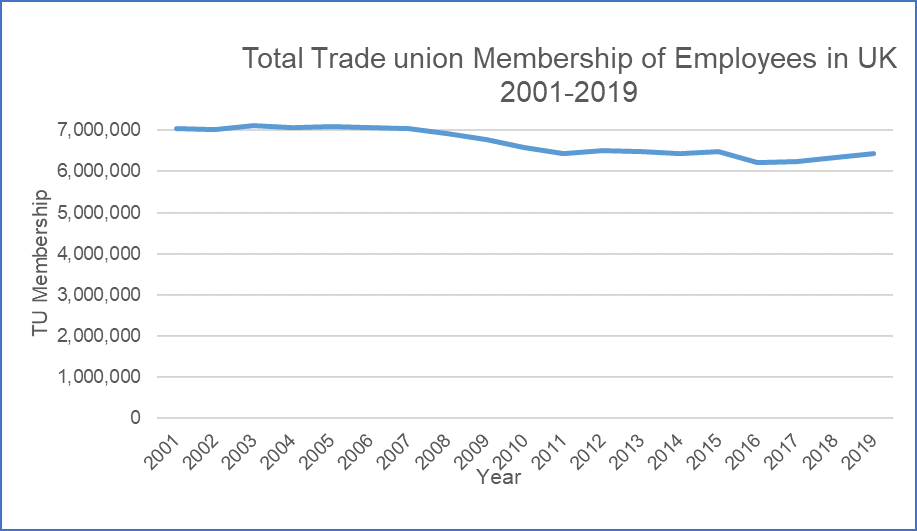
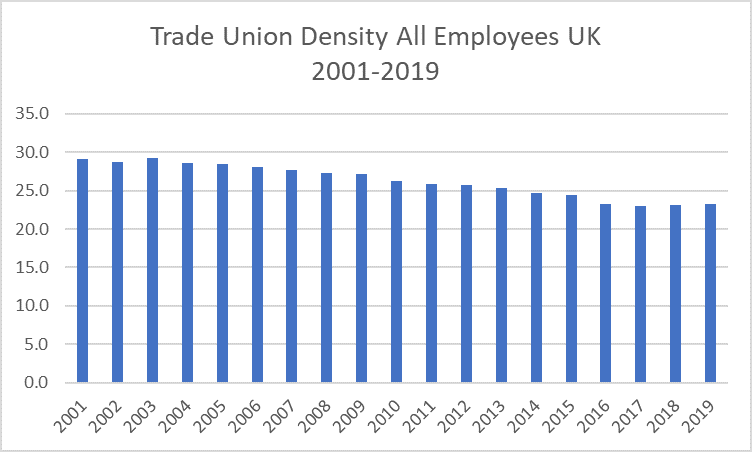
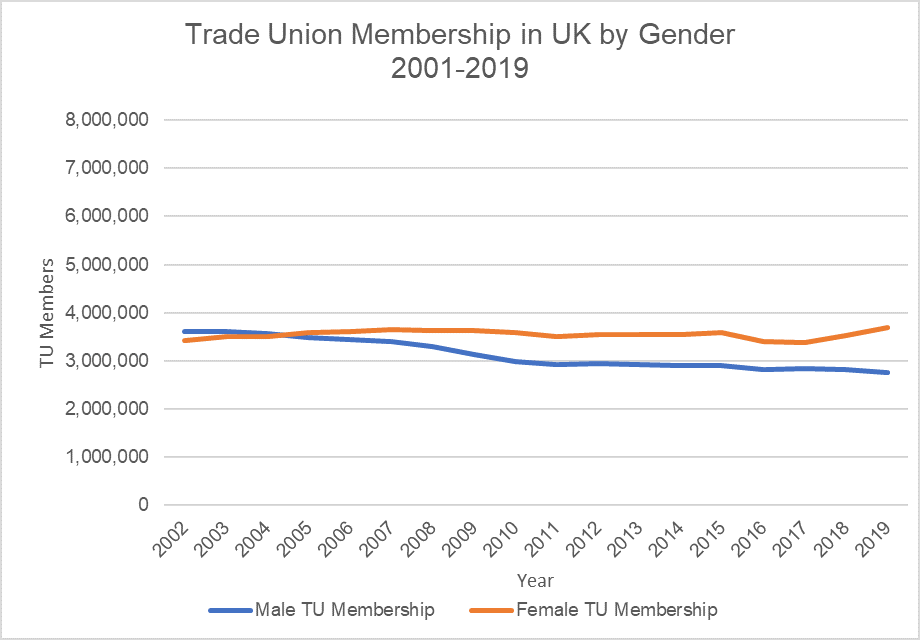
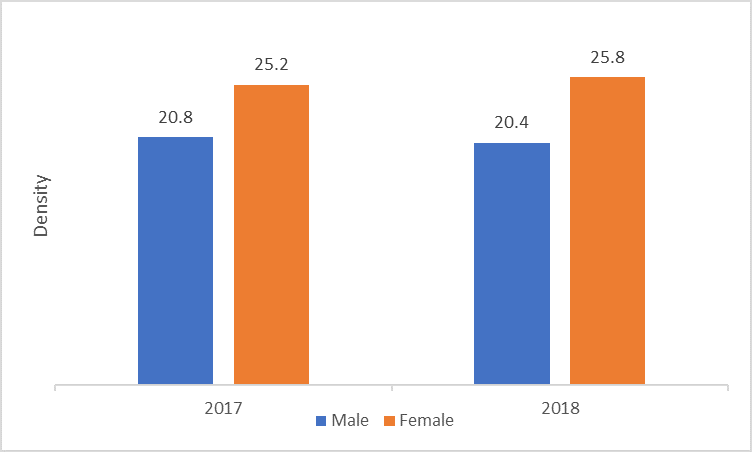
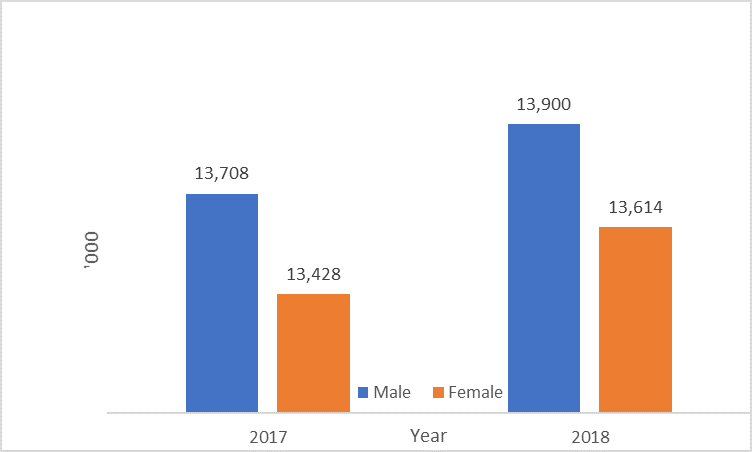
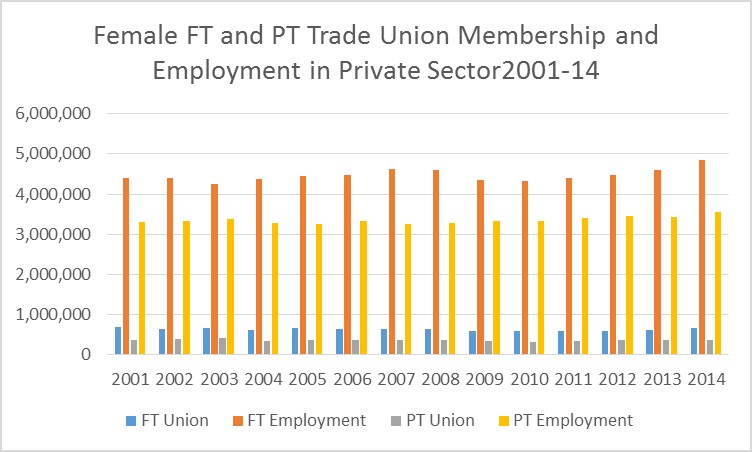
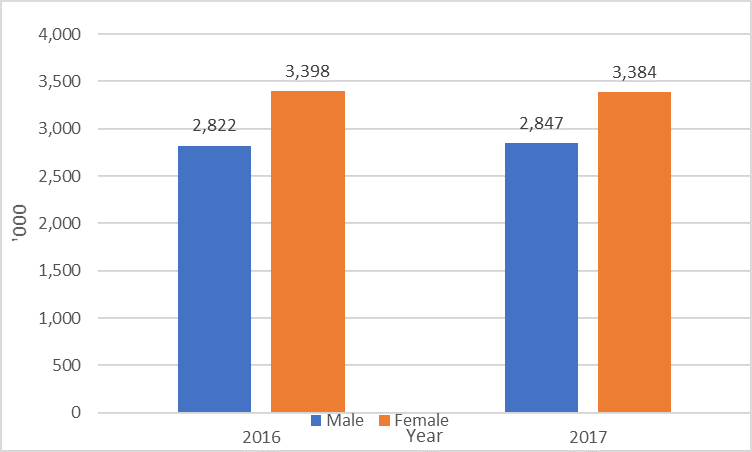
Fig 1: Female and Male Trade Union Membership 2016-17Source ONS


2 Trade Union Density 

However, trade union density for both female and male density has decreased. Between 2016 and 2017 male trade union density declined by 0.1 from 20.9 per cent to 20.8 per cent, a decrease of 0.7per cent – see Figure 2.  Even though male trade union membership increased between 2016 and 2017 the reason why the trade union density did not increase was that male employment increased at a greater rate – see Figure 4 – than the trade union membership.

Female trade union density declined was greater than the male density, it declined by 0.4 from 25.6 per cent to 25.2 per cent, a percentage decrease of 1.5 per cent.

Trade Union Density
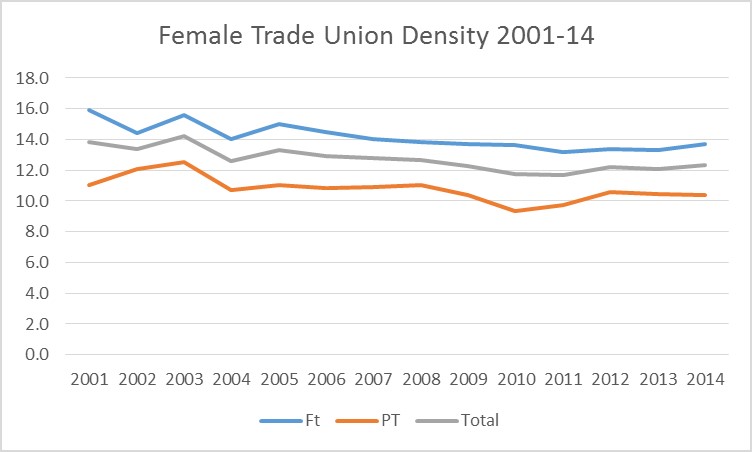
Fig 2: Female and Male Trade Union Density 2016-17 Source ONS


3 Trade Union Composition

The composition of male trade union employees between 2016 and 2017 increased by 0.3 from 45.4 to 45.7 per cent, an increase of 0.7 per cent – see Figure 3. It is axiomatic that the female composition decreased by 0.3 from 54.6 to 54.3 per cent.

Trade Union Composition
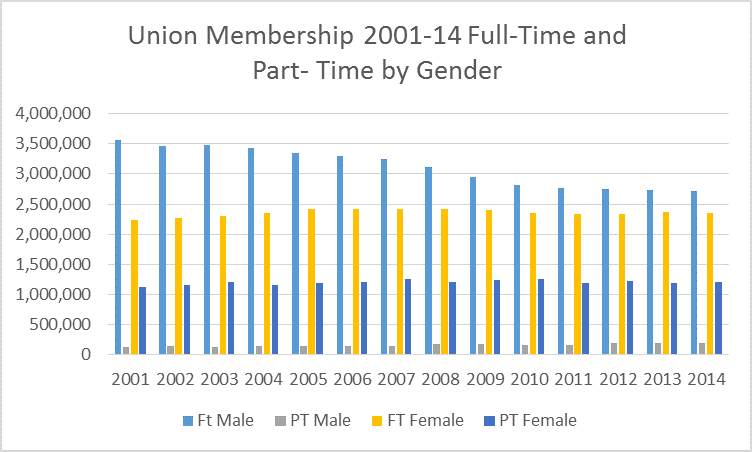
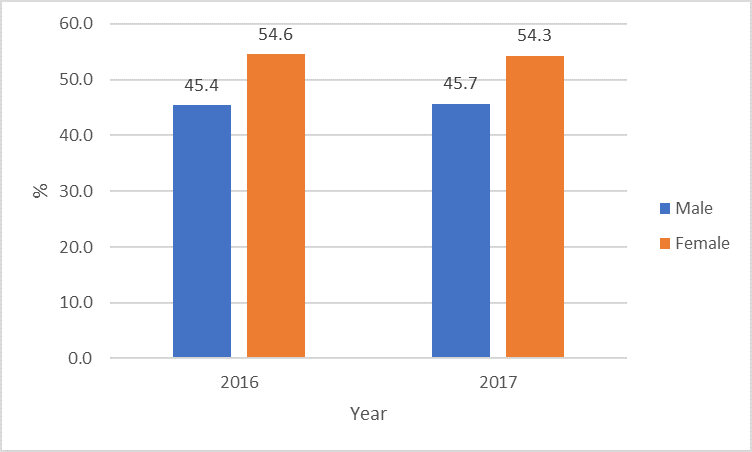
Fig 3: Female and Male Trade Union Composition 2016-17 Source ONS. 

4 Employment

Between 2016 and 2017 male employees increased by 210,000 from 13.5m to 13.7m an increase of 1.6 per cent. For female employees they had an increase of 148,000 from 13.3m to 13.4m a increase of 1.1 percent – see Figure 4.

EmploymentFig 4: Female and Male Employment 2016-17 Source ONS

5 Employee Composition

In between 2016 and 2017 the male composition increased by 0.1 from 50.4 to 50.5 percent an increase of 0.2 percent – see Figure 5. Like trade union composition it is axiomatic that the female composition decreased by 0.1 for 2016-17.

Employment Composition
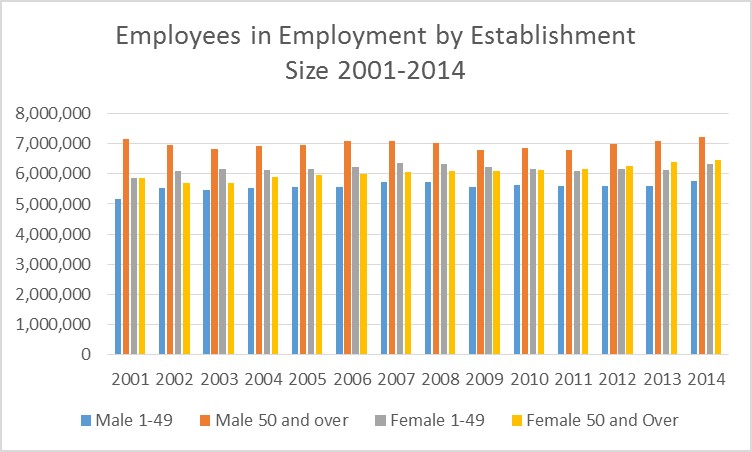
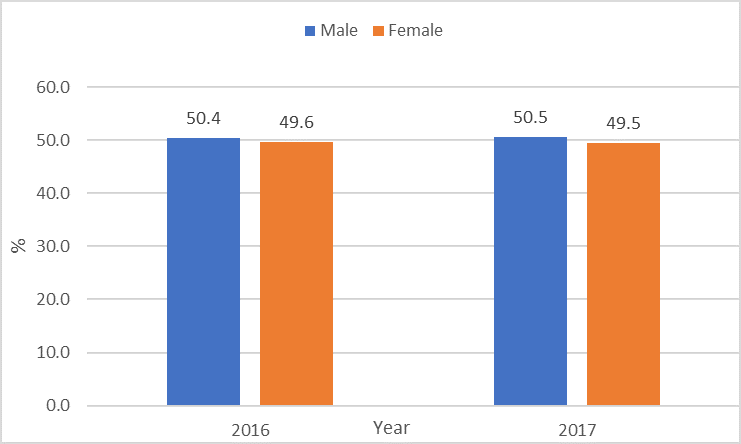
Fig 5: Female and Male Employment Composition 2016-17 Source ONS 

Technical Note

The Department for Business, Energy & Industrial Strategy (BEIS) will publish its Trade union membership 2017: statistical bulletin at the end of April or the beginning of May. The BEIS figures may differ slight from the figures used in this blog. There are three reasons for this. The first is rounding errors, and the second is that we are using a more aggregated data set than that used by BEIS. Third is the weight used by BEIS used in its calculations. Unfortunately, BEIS does not report the weighting used in its bulletin so it is possible that we are using a different weighting to BEIS. However, the differences should be well within normal statistical errors.

Where have 600,000 Trade Union Members Gone? Using the Labour Force Survey to Estimate Changes in Trade Union Membership between 2001 and 2015

The paper starts by explaining the methodology used to calculate trade union membership used by BIS. It then explains the importance of using imputation when calculating trade union membership. It then explains the sampling variance and how this needs to be taken into account when using the LFS


It then looks at changes in trade union membership using trade union density and the composition of the workforce for a number of variables.  These variables are: gender; full-time vs part-time; establishment size; industry; UK regions; occupations; changes due to age; private vs public sector; trade union coverage; and trade union presence.


However, it warns against relying solely on using trade union density to explain changes in trade union membership.


The initial analysis showed that the manufacturing sector was most effected by loss of union membership and employment. Therefore this sector was analysed in greater detail. This analysis showed that 637,420 union members were lost from this sector, and 1.2 million jobs were also lost during the same period – see 4.6.1 Manufacturing


The paper concludes by stating that we can say the decline in union membership came primarily from the core working age group and the manufacturing occupations.


See White Paper: Overview of Change in Trade Union Membership White Paper Complete

Changes in Trade Union Membership in the Public Sector

In this blog we will look at the changes in trade union membership in the public sector in the United Kingdom (UK). We start by examining the overall changes in trade union membership. Then we look at the changes in trade union membership by employment status. We then examine the changes in male trade union membership by employment status. Finally, we examine the changes in female trade union membership, again by employment status.

As with previous blogs the data source for this analysis is the Labour Force Survey Oct-Dec 2001-2014.

Overall Change in Trade Union Membership in the Public Sector

Between 2001 and 2014 total trade union membership in the public sector in the UK declined by 27,420 a decline of nine per cent – see Fig 1. Overall trade union density declined from 59.5 per cent to 54.1 per cent, a percentage change of nine per cent over this period.

Fig 1

Fig 1

During the same period public sector employment increased by just under 565,000, an increase of  9.1 percent, from just over 6.2m to just over 6.8m.


Change in Trade Union Membership by Employment Status

Between 2001 and 2014 full-time (FT) trade union membership in the public sector of the UK declined by just over 121,500 from just 2.9m to just under 2.8m, a decline of 4.2 per cent – see Fig 2.

Overall trade union density for FT trade union members declined from 67.5 per cent to 57.8 per cent, a percentage change of 14.3 per cent over the period.

Fig 2.jpg

Fig 2

The change in part-time (PT) trade union membership between 2001 and 2014 was positive. It increased by per 11.7 cent from just under 805,000 to just under 899,000. At the same time trade union density increased by 8.4 per cent from 41.7 per cent to 45.2 per cent.

Change in Male Total Trade Union Membership by Employment Status

Between 2001 and 2014 male trade union membership in the public sector declined by 230,598, from 1.4m to 1.2m, a decrease of sixteen per cent – see Fig 3. And trade union density decreased by 14.3 per cent from 67.5 per cent to 57.8 per cent.

Fig 3

Fig 3

Over the same period male public sector employment increased by 122,404 from 2.2m to 2.3m an increase 5.6 per cent.

Change in Female Total Trade Union Membership by Employment Status

Between 2001 and 2014 female trade union membership in the public sector increased by 203,178 from 2.3m to 2.5m, an increase of nine per cent – see Fig 3. However, trade union density declined slightly from fifty-six per cent to fifty-five per cent a decrease of 1.8 per cent. These apparent contradictory figures can be explained by the increase in total female employment which increased by 442,589 from 4m to 4.5m, an increase of nearly eleven per cent.

Change in Male Trade Union Membership by Employment Status

Between 2001 and 2014 FT male union membership in the public sector decreased by 254,738 – see Fig 4. From just under 1.4m to 1.1m, a decline of 18.4 per cent. This deterioration was not as great as that for the private sector of 27.6 per cent for the same period. However, it would appear to reinforce the evidence from previous blogs – see: https://thedocsblogblog.wordpress.com/ – that one of the major factor in the decline of trade union membership in the UK is due to the decrease of male FT trade union membership.

Fig 4.jpg

Fig 4

During the same period FT male employment in the public sector increased by 40,864 from just over 2m, an increase of 2.0 per cent.

In regards to PT male trade union membership in the public sector between 2001 and 2014 it increased by 24,140 from 56,000 to 80,226, and increase of 43 per cent. During the same period PT employment increased by 81,540 from 179,070 to 260,610, and increase of 45.5 per cent.

Trade union density declined during this period by 1.7 per cent from 31.3 to 30.8 per cent.


Change in Female Trade Union Membership by Employment Status

During the same period FT female union membership in the public sector increased by 133,152 – see Fig 5. From over 1.5m to 1.65m, an increase of 8.8 per cent.

Fig 5

Fig 5

At the same time, FT female employment increased by 466,043 from 2.3m to 2.7m an increase of twenty per cent.

In contrast, trade union density declined over this period from 66.1 per cent to 59.8 per cent, a decrease of 6.3 per cent.

In regards to PT female union membership, this increased by 9.4 per cent from 748,714 to 818,741. During the same period employment declined from 1,751,336 to

1,727,882, a decrease of 1.3 per cent. And trade union density increased from 42.8 to 47.4 per cent, an increase of 10.8 per cent.

Summary

Trade union density in the public sector density is considerably larger than in the private sector – see Fig 6. Although in regards to employment it is only a third of the size of the private sector. However, between 2001 and 2014 it has declined over all by nine per cent. While the private sector decreased by 23.6 overall.

Fig 6

Fig 6

However, like the male FT private sector trade union  membership it has had the largest decrease in membership of the four employment status groups in the public sector, a decline of 18.4 per cent – see Fig 7.

The decline of 254,738 members accounts for thirty-two per cent of the total decline in total trade union membership in the UK between 2001 and 2014.

Fig 7


Fig 7

In the forthcoming blogs we will examine what has happened to trade union membership by individual industries to see if this can help explain this decline.


Changes in Trade Union Membership in the Private Sector

In this blog we will look at the changes in trade union membership in the private sector in the United Kingdom (UK). We start with the overall changes in trade union membership. Then we examine the changes in trade union membership by employment status. We then look at the changes in male trade union membership. Finally we examine the changes in female trade union membership.

As with previous blogs the data source for this analysis is the Labour Force Survey Oct-Dec 2001-2014.

Overall Change in Trade Union Membership in the Private Sector


Between 2001 and 2014 total trade union membership in the private sector in the UK declined by just over 592,000, a decline of eighteen per cent – see Fig 1. Overall trade union density declined from 18.4 per cent to 14.0 per cent, a percentage change of 23.6 per cent over this period.

Fig 1

Fig 1

During the same period private sector employment increased by 1,303,269 an increase of 7.3 percent, from just over 17.9m to just under 19.2m.

Change in Trade Union Membership by Employment Status

Between 2001 and 2014 full-time (FT) trade union membership in the private sector of the UK declined by just over 630,000 from just under 2.9m to just under 2.2m, a decline of twenty-two per cent – see Fig 2.

Overall trade union density for FT trade union members declined from 20.8 per cent to 15.4 per cent, a percentage change of 25.7 per cent over the period.

Fig 2

Fig 2

The change in part-time (PT) trade union membership between 2001 and 2014 was marginally positive. It increased by 8.6 per cent from just over 437,000 to just under 475,000. However, at the same time trade union density declined by 5.9 per cent from 10.5 per cent to 9.8 per cent.

Change in Male Trade Union Membership

Overall FT male union membership in all sectors (private and public) in the UK declined by 853,596 between 2001 and 2014 – see https://thedocsblogblog.wordpress.com/2016/02/23/trade-union-membership-ft-and-pt-by-gender/. During the same period FT male union membership in the private sector decreased by 595,306 – see Fig 3. Therefore we can say that approximately seventy percent of the decline in FT male union membership between 2001 and 2014 was a result of the decline in the private sector trade union membership.

Fig 3

Fig 3

Between 2001 and 2014 FT employment in the private sector increased by 210,683 from just over 9.3m to just over 9.5m, an increase of 2.3 per cent.

PT trade union membership in the private sector between 2001 and 2014 increased by 32,500 from under 74,000 to just over 106,000, and increase of 44.2 per cent. During the same period PT employment increased by 32,564 from 879,168 to 1,280,568, and increase of 45.7 per cent.

Fig 4

Fig 4

 In regards to trade union density, FT density declined from 23.1 per cent to 16.3 per cent, a decline of 29.2 per cent – see Fig 4. For PT density it stayed relative stable at 8.3 per cent, although it reach a low of 6.1 per cent in 2005. Total union density decreased 29.5 per cent from 21.8 per cent to 15.4 per cent

Change in Female Trade Union Membership

Between 2001 and 2014 female FT trade union membership decreased by 5.0 per cent from 698,486 to 663,732 – see Fig 5. During this period PT trade union membership increased slightly by 1.4 per cent from 363,507 to 368,672 an increase of 5,165.

Fig 5

Fig 5


FT employment during this period increased by 10 per cent from 4.4m to 4.8m. PT employment increased slightly by 1.4 per cent from 3.3m to 3.5m.

FT trade union density declined by 13.8 per cent from 15.9 per cent to 13.7 per cent – see Fig 6

Fig 6

Fig 6

PT trade union density declined by 5.5 per cent from 11.0 per cent to 10.4 per cent. Total PT trade union density declined by 10.8 per cent from 13.8 per cent to 12.3 per cent.

Summary

As with previous blogs, this blog has identified that the major decline in the trade union membership in the UK is a result of the decline of FT male trade union membership. The most striking figure to come out of the current research into changes in trade union membership is that approximately seventy per cent of the decline in overall FT male union membership between 2001 and 2014 was a result of the decline in FT private sector trade union membership.


The question for a future blog will be, were there any particular sectors where this decline was significant? Or was it a general decline across all sectors?


In the next blog we will examine the changes that have taken place in the public sector trade union membership.


Trade Union Membership FT and PT by Gender

In this blog we will examine what changes have taken place in trade union membership in the United Kingdom by full-time and part-time status, and by gender between 2001 and 2014. We will also examine the changes that have taken place in employment, again by full-time and part-time status, and by gender.

Changes in Male Union Membership

Between 2001 and 2014 male FT trade union membership declined by 853,596 from just under 3.6m to 2.7m. This was a decrease of 24.0 per cent, and over sixty per cent of the loss occurred between 2007 and 2014.

In regards to trade union density, this declined from 31.4 per cent to 23.3 per cent, a decrease of nearly 26 per cent.

Male PT trade union membership however increased by 56,534 from 134,090 in 2001 to 190,624. However, trade union density decreased by 2.7 per cent from 12.6 per cent to 12.3 per cent. This was due to the increase in the number of PT male employees – see below.

Union membership 2001-14 FT and PT by gender

Changes in Female Union Membership

In contrast to male FT trade union membership female FT membership increased by 119,594 from 2.2m to just under 2.4m, an increase of 5.4 per cent. FT female union membership peaked in 2008 at just over 2.4m, but has declined moderately since then to 2,352,309.

Trade union density has declined by 7.4 per cent from 33.3 per cent to 30.9 per cent. And like male union density, this is due to the increased number of female employees.

Female PT union membership increased by 78,049 from just over 1.1m to just over 1.2m an increase of 7.0 per cent. Trade union density increased from 22.1 per cent to 22.7 per cent, an increase of 2.4 per cent, even though female PT employment increased over the period.

Changes in Employment

Male Employees

Between 2001 and 2014 male FT employees increased by 2.3 per cent from just under 11.4m to just over 11.6m. For PT male employees there was a considerable increase of 46.1 per cent from under 1.1m to just under 1.6m.

Union membership 2001-14 FT and PT by gender.png

Female Employees

Between 2001 and 2014 female FT employees increased by 13.7 per cent from 6.7m to 7.6m an increase of 921,621. For female PT employees increased by 4.5 per cent from 5.0m to 5.3m.

Summary

Looking at the data it confirms the analysis of earlier blogs that the decline in trade union membership is due to the decline of male trade union membership. However, this analysis specifically identifies that it is male FT trade union membership as the major factor in this decline. The reasons for this are not yet clear.

In the next two blogs we will examine what has happened to trade union membership in the private and public sector, which may go in some way to answer this question.


Trade Union Membership by Establishment Size

Like the previous blogs, we are using data from the Labour Force Survey for October-December between 2001 and 2014.


Changes in male trade union membership

 Males trade union membership in establishments between 1-49 employees membership deceased by 20.4 per cent between 2001 and 2014. Declining from approximately 842,000 to approximately 670,000. Between 2001 and 2014 trade union density declined by 28.6 per cent from 16.3 per cent to 11.6 per cent.

For male trade union membership in establishments with employees of 50 and over there was a similar decrease of 22.6 per cent from 2.8 million to 2.2 million between 2001 and 2014. Trade union density during this period declined by 23.3 per cent from 39.6 per cent to 30.4 per cent.

Trade union membership by establishment size.png

Changes in female trade union membership

Unlike male trade union membership by establishment size female trade union membership remained stable or increased.

Females trade union membership in establishments between 1-49 employees’ trade union membership increased by 0.7 per cent between 2001 and 2014. Increasing from approximately 1.1 million to approximately 1.2 million. However, between 2001 and 2014 trade union density declined by 9.7 per cent from 16.3 per cent to 11.6 per cent.

For female trade union membership in establishments with employees of 50 and over. Overall trade union membership increased by 8.2 per cent from 2.2 million to 2.3 million between 2001 and 2014. Trade union density during this period declined by -2.0 per cent from 36.8 per cent to 36.1 per cent.

Changes in Employment in Establishment Sizes

Male Employment in establishments between 1 and 49 employees increased by 11.4 per cent between 2001 and 2014. Increasing from just under 5.2 million to just under 5.8 million.

During the same period male employment in establishments of 50 and over employees remained stable increasing by 0.9 per cent.

Employees in Employment by Establishment sSize

Female employment in establishments between 1 and 49 employees increased by 8.0 per cent between 2001 and 2014. Increasing from just under 5.9 million to just over 6.3 million.

During the same period female employment in establishments of 50 and over employees increased by 10.4 per cent from just over 5.8 million to under 6.5 million..

Summary

It has been argued that trade union membership has declined in part due to the increase of smaller firms. However, looking at this data set it is difficult to see that this is the case. It is however possible that because we are using aggregated data, we are missing some elements of this effect. To examine this in more detail would require dis-aggregating the data into smaller classes e.g. 1-10, 11-20, 21-30, 31 to 40, and 41 to 49. Also the time series may need to be extended backward to see if this effect was more pronounced before 2001. When we do a more detailed analysis for the research article this may be clearer.

However, the decline in trade union membership by establishment size does appear to be due to falling male trade union membership, in percentage terms, as we have seen in previous blogs.