Trade Union Membership by Age Groups

In this blog we will examine the changes in trade union membership in the United Kingdom (UK) by major age groups and sex. The major age groups used are: 16-24; 25-54; and 55 and over. The data source for these statistics is the UK Labour Force Survey October-December quarters.

16-24 Age Category
Taking the 16-24 age category we see that for males trade union membership declined by 30.8 per cent from approximately 222,000 to nearly 154, 000. For females the decrease was considerably larger at 48.5 per cent from 28,500 to just under 14,700.

Union membership by major age groups

25-54 Age Category
If we examine the 25-54 age category we clearly see that there has been a major decline in male trade union membership. Between 2001 and 2014 male trade union membership in the UK declined by 27.1 per cent. From nearly 2.9m to just under 2.2m.

During the same period the decline in female trade union membership was only 1.5 per cent. Down from nearly 2.8m to just over 2.7m.

55 and Over Age Category
This group is the only group to an increasing level of union membership, although there is a marked difference between the sexes. For male trade union members membership increased by 11.4 per cent from nearly 560,000 to nearly 624,000. For female trade union members over the same period the membership increased by 69.1 per cent from just under 398,000 to nearly 673,000, an increase of nearly 275,000.

Change in Employment
It may be tempting to attribute the decline in male trade union membership to changes in overall employment levels for employees. However, this is not the case, if we look at the change of overall employment of employees between 2001 and 2014 it increased by 7.9 per cent from just over 24.2m to just over 26.1m.

Male and Female Employment 2001-14
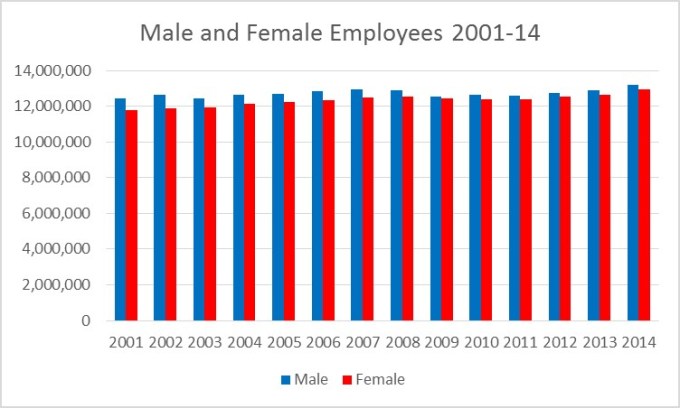
Male employment increased by 6.1 per cent from 12.4m to just under 13.2m.

During the same period female employment increased by 9.8 per cent from just under 11.8m to just over 12.9m.

Summary
Unless the trade unions can make inroads into recruiting from the 16-24 age category they will in the mid-term find it difficult to maintain or even increase membership in the core employment group 25-54 category.

The decline in male trade union membership for the age category 25-54 will be of real concern to the trade unions. This is the core employment group, and failing to maintain the membership in this group can only result in a long-term decline in overall membership.

The only group to increase membership was the 55 and over category, and this increase would be due in the main to members moving from the 25-54 to the 54 and over age category. Also more people are working beyond the age of 65. In the longer term, if the current trends persist, the current increase will not be sustainable as fewer members will transfer from the 25-54 to the 54 and over age category.


Changes in Trade Union membership by Region

In this post we will look at the changes that have taken place in trade union membership by United Kingdom regions. First we will look at the numerical changes between 2001 and 2014, and then we will look at the percentage changes.

In terms of actual numbers the North West has the largest number of trade unionists, with just over 806,000 in 2014. However, this down from 925,000 in 2001, a decrease of 118,000. The second largest union membership in 2014 was in the South East, which had 690,000 members. Between 2001 and 2014 the trade union membership in the South East declined by nearly 93,000. However, the second largest decrease in actual trade union membership occurred in the West Midlands. Membership here declined by just under 95,000 to 551,000 from just over 646,000.

Two regions Yorkshire and Humberside, and Wales effectively maintained their membership with increases of 324 and 1,677 respectively.

Trade union membership by UK region 2001 and 2014
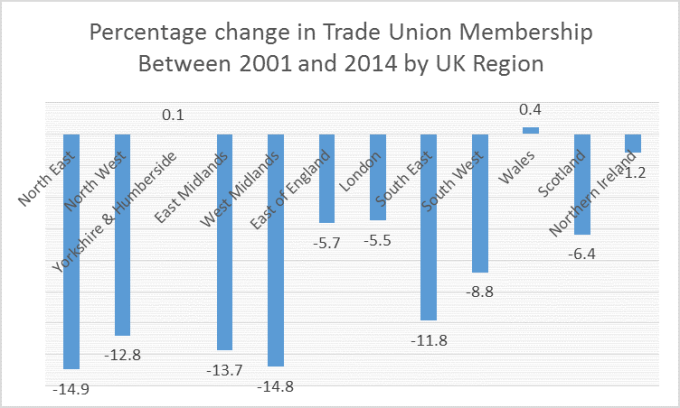
The average decrease for the regions was just under 50,000.

Looking at the Percentage Changes

Looking at the absolute changes does not gives us a clear picture as to what is happening to changing trade union membership in the UK regions. This graph shows the changes in trade union membership in percentage terms between 2001 and 2014. This shows that the largest percentage decline occurred in the North East, where it declined by just under fifteen percent. This was followed by the West Midlands, again just under fifteen percent. Next came the East Midlands with a decline of just under fourteen percent.

Only Wales and Yorkshire and Humberside had marginal positive percentage growth.

The average percentage decline for the UK regions was just under eight percent.


Percentage change in trade union membership between 2001 and 2014 by UK region


Where have over half a million trade union members gone?

This is the first of an occasional series of posts about what has happened to trade union membership between 2001 and 2014 in the United Kingdom, using data from the Labour Force Survey. This is part of ongoing research into changing trade union membership which it is hope will be published in the not too distant future. The paper, if published, will contain a much more detailed statistical analysis than will be published in these posts.

In this first post we shall look at what has happened to overall employment of employees at the aggregate level. Then we shall look at what has happened to trade union membership by gender, again at the aggregate level. In later posts will look at the following metrics: age; region; establishment size; employment status; union presence and coverage; and industry.

Between 2001 and 2014 male employees employment increased by just over six percent, from
12.4m to 13.2m. During the same period female employees employment increased by nearly ten percent from 11.8m to 12.9m.

Employment and Union Membership by Gender 2001-14
Source: Labour Force Surveys 2001-2014

To calculate the trade union membership we have used the methodology used by the authors of the various issues of the Trade Union Membership Statistical Bulletin, published by the Department for Business, Innovation and Skills (BIS) – see: https://www.gov.uk/government/collections/trade-union-statistics. We have used the data sets 2001 to 2014 for our analysis, as this has a constant weighting (PWT14) for the series, also it has a consistent set of variables. Prior to 2001 questions on trade union presence and coverage were not asked.

In regards to male trade union membership, during this period the trade union membership for employees declined by just over twenty-one percent from 3.7m to 2.9m. Between 2001 and 2007 it declined by just over eight percent from 3.7m to 3.4m, a decrease of 296,144. Between 2007 and 2014 the membership declined by over fourteen percent from 3.4m to 2.9m, a decrease of 497,040.

Conversely, female trade union membership for employees during this period increased by nearly six percent from 3.4m to 3.5m, an increase of 195,797. Between 2001 and 2007 the membership increased by just over nine percent, from 3.4m to 3.6. Between 2007 and 2014 the membership fell slightly by nearly three percent from 3.7m to 3.5m.
Probably the most sociological and economically important event happened in 2005, when for the first time female trade union membership was greater than male trade union membership. And this continues to be the case today.

In conclusion, despite the growth of female union membership this has failed to stop the overall decline in trade union membership in the UK. Which has declined over all by eight-and-a-half percent from 7.0m to 6.4m. Despite overall employees in employment increasing by nearly eight percent from 24.2m to 26.1m.

It is hoped that the more detailed research, referred to earlier in this post, may help to explain some of the reasons why this decline occurred