Changes in Trade Union Membership by Employment Status and Gender 2001-19

In the previous blog – First Estimates of Trade Union membership in 2019  – we discussed the change in trade union (TU) membership by gender between 2001 and 2019 in the United Kingdom for employees. In this blog, we shall analyse changes in TU membership by employment status and gender for the same period using changes in TU density, employment, and the composition of the workforce for our analysis.

The data source for this analysis is the Office of National Statistics (ONS) labour force survey (LFS) Oct-Dec for the years 2001-2019.

Fig 1: Changes in Trade Union Membership by Gender and Employment Status 2001-2019.
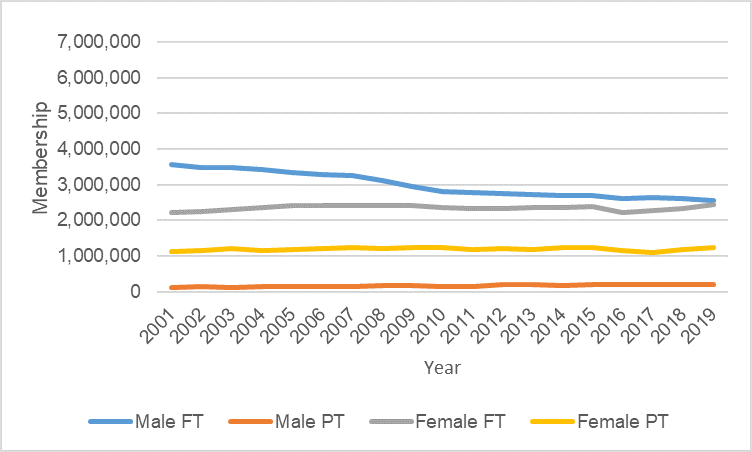
Source: ONS LFS

From Fig 1, we can see that full-time (FT) male TU membership declined by just over one million, a decline of 28 per cent. During the same period, there was an expansion in female TU membership of 201,000, a nine per cent growth.

Part-time TU male membership grew by 67,408 an increase of 50.3 per cent. At the same time, female TU membership increased by134,665 a growth rate of 12.0 per cent.

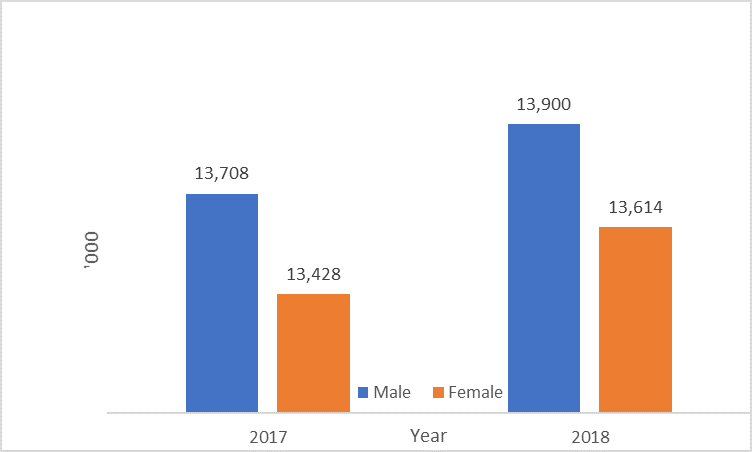
Fig 2, shows the change in employment status by gender between 2001 and 2019. Male FT employment increased by 904,377 a growth rate of 8.0 per cent. At the same time, PT male employment grew by 49.0 per cent an increase of 522,448.

Fig 2: Change in employment by gender and employment status 2001-2019.

Source: ONS LFS

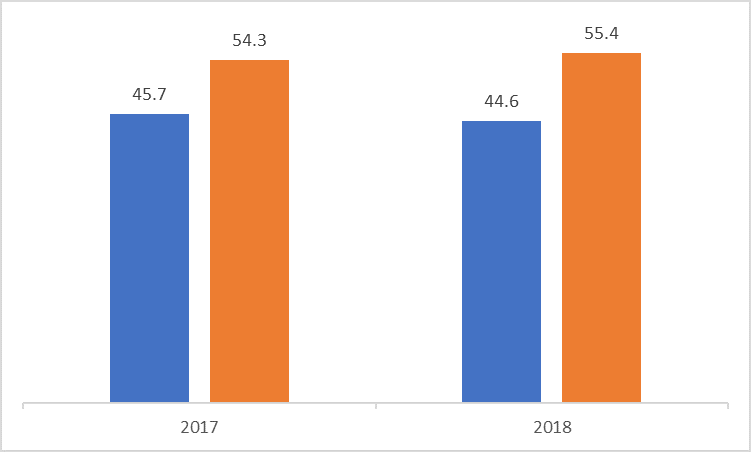
Female FT employment increased significantly by 1,745,950 a 26.0 per cent increase. At the same time, female PT employment climbed by 259,924 a rise of 5.1 per cent.

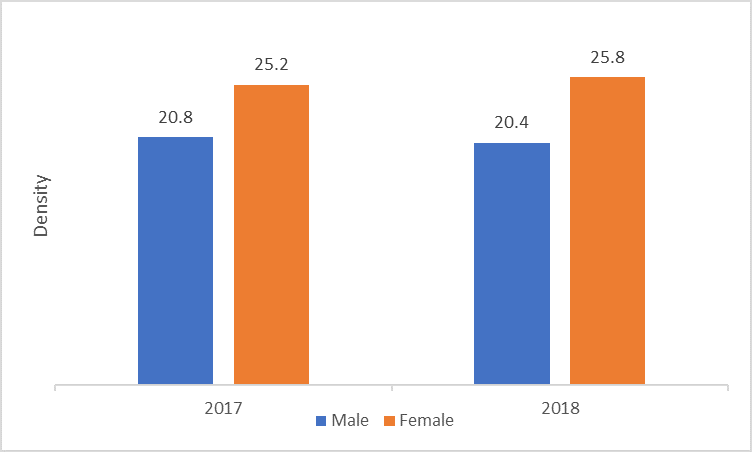
In Fig 3, we show the changes in the composition of employees by gender and employment status between 2001-2019. The male FT composition declined by 2.6 per cent from 47.0 to 44.4 per cent. Conversely, the male PT composition of the workforce increased by 1.3 per cent from 4.4 to 5.7 per cent.  During the same period, the female structure increased by 2.9 per cent to 30.6 per cent. There was a slight decline in the female PT composition of 1.7 per cent from 20.9 to 19.3 per cent.

Fig 3: Changes in the Composition of Employees by Gender and Employment Status 2001-2019
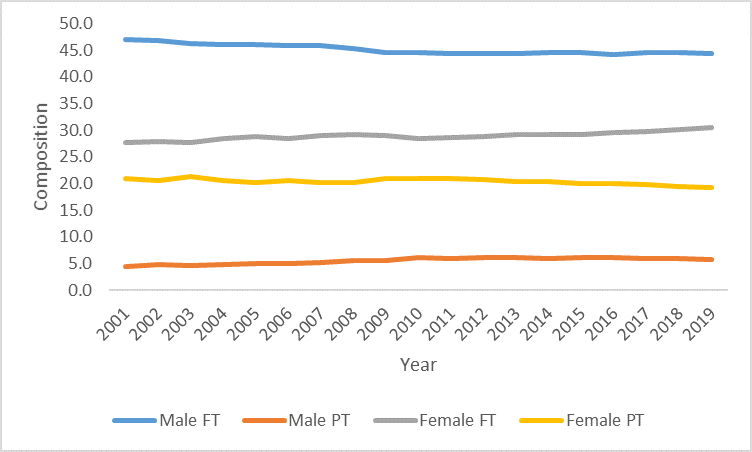
Source: ONS LFS

By using the composition of employees, it has allowed us to identify precisely that the significant change in TU membership has been in male FT membership. This decline of 1.01m FT male TU members has to assessed in the context of the 0.9m jobs created. Even without the 0.9m increase in male FT employment, the TU density would have been 23.5, resulting in an 8.9 decline in density to 22.5.

In future blogs, we will look in more detail at where this 1.01m decline FT male members occurred.

First Estimates of Trade Union Membership in 2018

The Department for Business, Energy & Industrial Strategy (BEIS) will publish its Trade union statistics 2018 statistical bulletin on the 30th May.

In anticipation of this we have estimated the changes in trade union membership in the United Kingdom (UK) using data from the 2017 and 2018 October – December Labour Force Survey(LFS) produced by the Office of National Statistics (ONS).

1 Trade Union Membership

Between 2017 and 2018 the total trade union membership, who are employees, increased  by 106,000, an increase of 1.7 per cent.

There has been a very small decrease in male trade union membership of 0.8 per cent, and a more substantial increase in female trade union membership of 3.8 per cent, or 128,000 – see Fig 1.

Female and Male Trade Union Membership

Fig 1: Female and Male Trade Union Membership 2017-18 Source ONS

2 Trade Union Density 

In this blog Trade Union density refers to the ratio of the number of employees who are members of trade unions to the total number of employees in the UK. Some academics use trade union density rates as a proxy for trade union power. The greater the trade union density the more powerful, in collective bargaining terms a trade union is assumed to be.

Between 2017 and 2018 male trade union density declined by 0.4 from 20.8 per cent to 20.4 per cent, a decrease of 2.1per cent.

Conversely female trade union density increased from 25.2 per cent to 25.8 an increase of 2.4 per cent – see Fig 2.

The total TU density increased by 0.1 per cent from 23.0 to 23.1 per cent.

Fig 2: Female and Male Trade Union Density 2017-18 Source ONS

3 Trade Union Composition

The composition of male trade union employees between 2017 and 2018 decreased by 1.1 from 45.7 to 44.6 per cent, a decrease of 2.4 per cent – see Figure 3. It is obvious that the female composition increased by 1.1 from 54.3 to 55.4 an increase of 2 per cent.

Fig 3: Female and Male Trade Union Composition 2017-18 Source ONS. 

4 Employment

Between 2017 and 2018 male employees increased by 192,000 from 13.7m to 13.9m an increase of 1.4 per cent. For female employees the increase in employment was slightly less at 186,000 from 13.7m to 13.9m an increase of 1.4 percent – see Figure 4.

Total employee employment increased by 378,000, an increase of 1.4 per cent.

Fig 4: Female and Male Employment ‘000 2017-18 Source ONS

5 Employee Composition

In the period between 2017 and 2018 the male and female composition of the employee workforce  remained stable at  50.5 per cent and 49.5 per cent  – see Figure 5.

Fig 5: Female and Male Employment Composition 2017-18 Source ONS 

Technical Note

The BEIS figures may differ slight from the figures used in this blog. There are three reasons for this. The first is rounding errors, and the second is that we are using a more aggregated data set than that used by BEIS. Third is the weight used by BEIS used in its calculations. Unfortunately, BEIS does not report the weighting used in its bulletin so it is possible that we are using a different weighting to BEIS. However, the differences are well within normal margins of statistical error.